Group Comparison
U.S. national vs. Texas, and why context matters.
The comparison
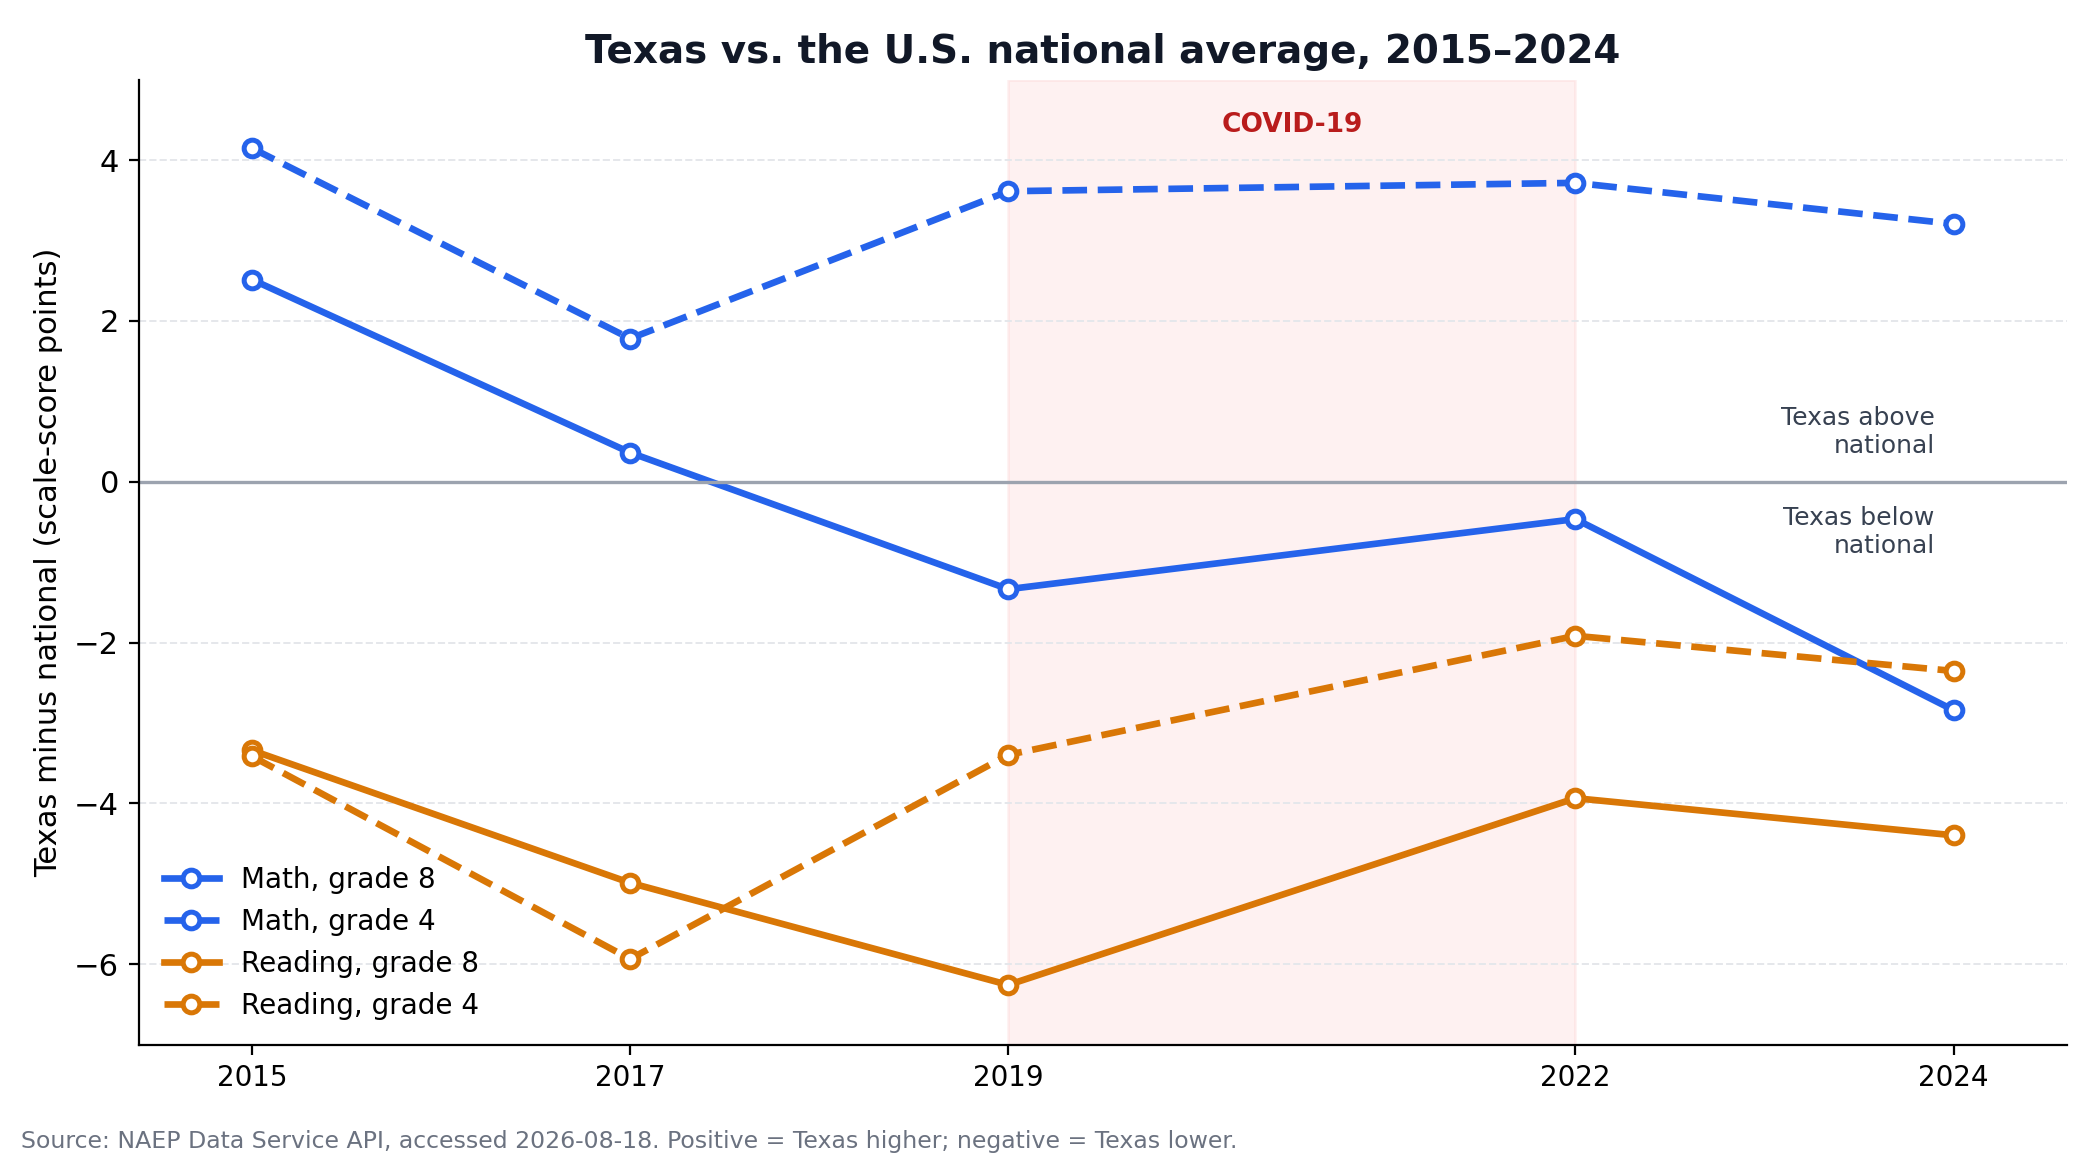
I compared the U.S. national public average to Texas, across grade 4 and grade 8 in mathematics and reading, for 2015–2024. Both are mean NAEP scale scores, so the comparison is on the same scale — no raw counts are involved, which keeps it fair.
| Subject / grade | U.S. national (2024) | Texas (2024) | Texas − national |
|---|---|---|---|
| Mathematics, grade 8 | 272.2 | 269.4 | −2.8 |
| Mathematics, grade 4 | 237.3 | 240.5 | +3.2 |
| Reading, grade 8 | 256.7 | 252.3 | −4.4 |
| Reading, grade 4 | 214.3 | 211.9 | −2.4 |
What it shows
Texas leads the nation in grade 4 math (+3.2), but trails it in grade 8 math (−2.8), grade 8 reading (−4.4), and grade 4 reading (−2.4). The most striking shift is grade 8 math: Texas was +2.5 above the national average in 2015 and is now −2.8 below it — a swing of about 5 points — and it kept falling through 2024 while the nation flattened.
Why this comparison is useful
A state comparison reveals what a single national average hides. Texas is the second-largest state in the country, so its trajectory affects millions of students — and the fact that its decline started earlier than the nation's points toward state-specific factors rather than the pandemic alone.
Context needed to interpret it fairly
The raw gap ignores student demographics. Texas educates a larger share of Hispanic students, economically disadvantaged students, and English learners than the national average. Because those groups score lower on average nationally, part of Texas's lower mean reflects who it educates, not only how well its schools perform. That context does not erase the gap, but it must temper any reading of the gap as a pure measure of school quality.