After COVID, U.S. Test Scores Fell — and Reading Kept Falling
A descriptive analysis of NAEP math and reading scores (grades 4 and 8), U.S. national and Texas, 2015–2024.
Data Science for Educators · Final Project
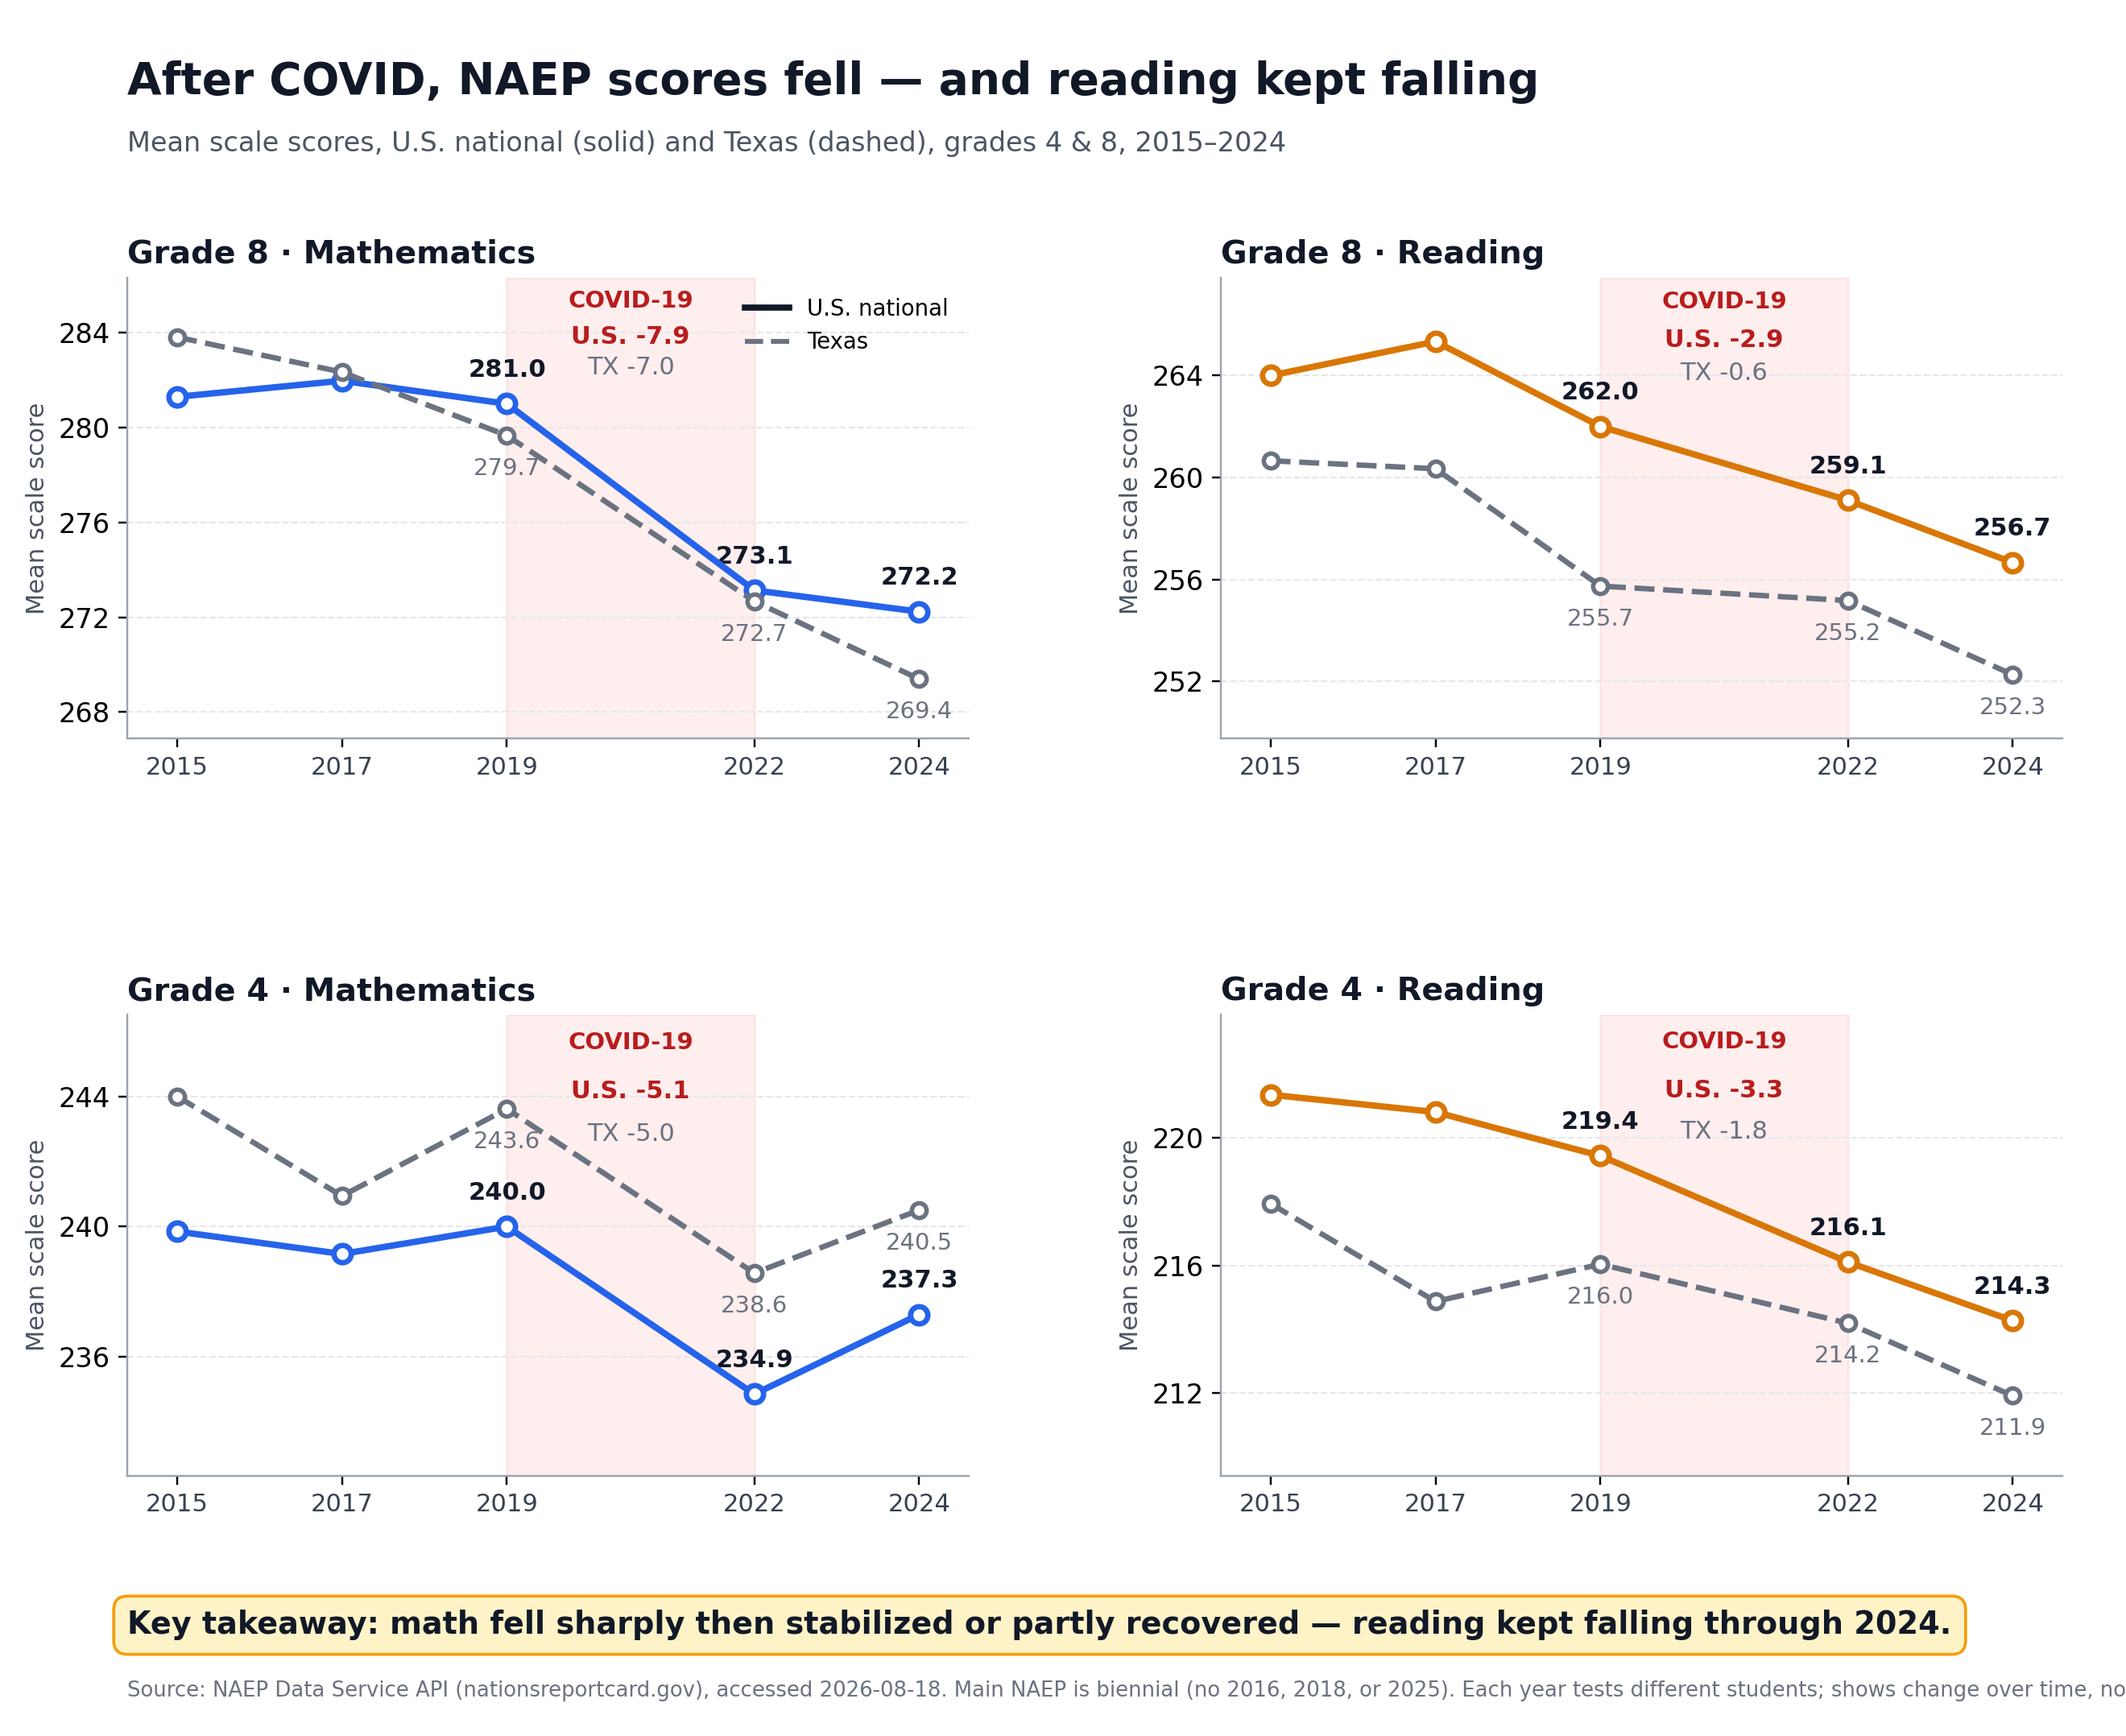
Were average NAEP math and reading scores lower after COVID than before?
Yes — in every subject and grade. Math is recovering; reading is still falling.
The findings at a glance
↓ 8.8 pts
Grade 8 math
The largest drop of the four tests.
↓ 5.3 pts
Grade 8 reading
Reading kept falling — a decade low in 2024.
↓ 2.7 pts
Grade 4 math
The smallest drop — and it is recovering.
↓ 5.2 pts
Grade 4 reading
Still falling at both grades.
Mean scale-score change, 2019–2024, U.S. national public schools. Texas tells a slightly different story — see the comparison.